“We switched from Datadog and cut our observability bill by 70% while keeping full fidelity data.”
— Engineering Lead, Series B SaaS
“OpenTelemetry-native from day one. Instrumented our entire stack in a weekend.”
— Platform Engineer, Fintech Startup
“The correlated logs and traces view alone saved us hours of debugging every week.”
— SRE Manager, E-commerce Platform
Everything you need to observe production
One platform for all your telemetry signals. No more juggling disparate tools.
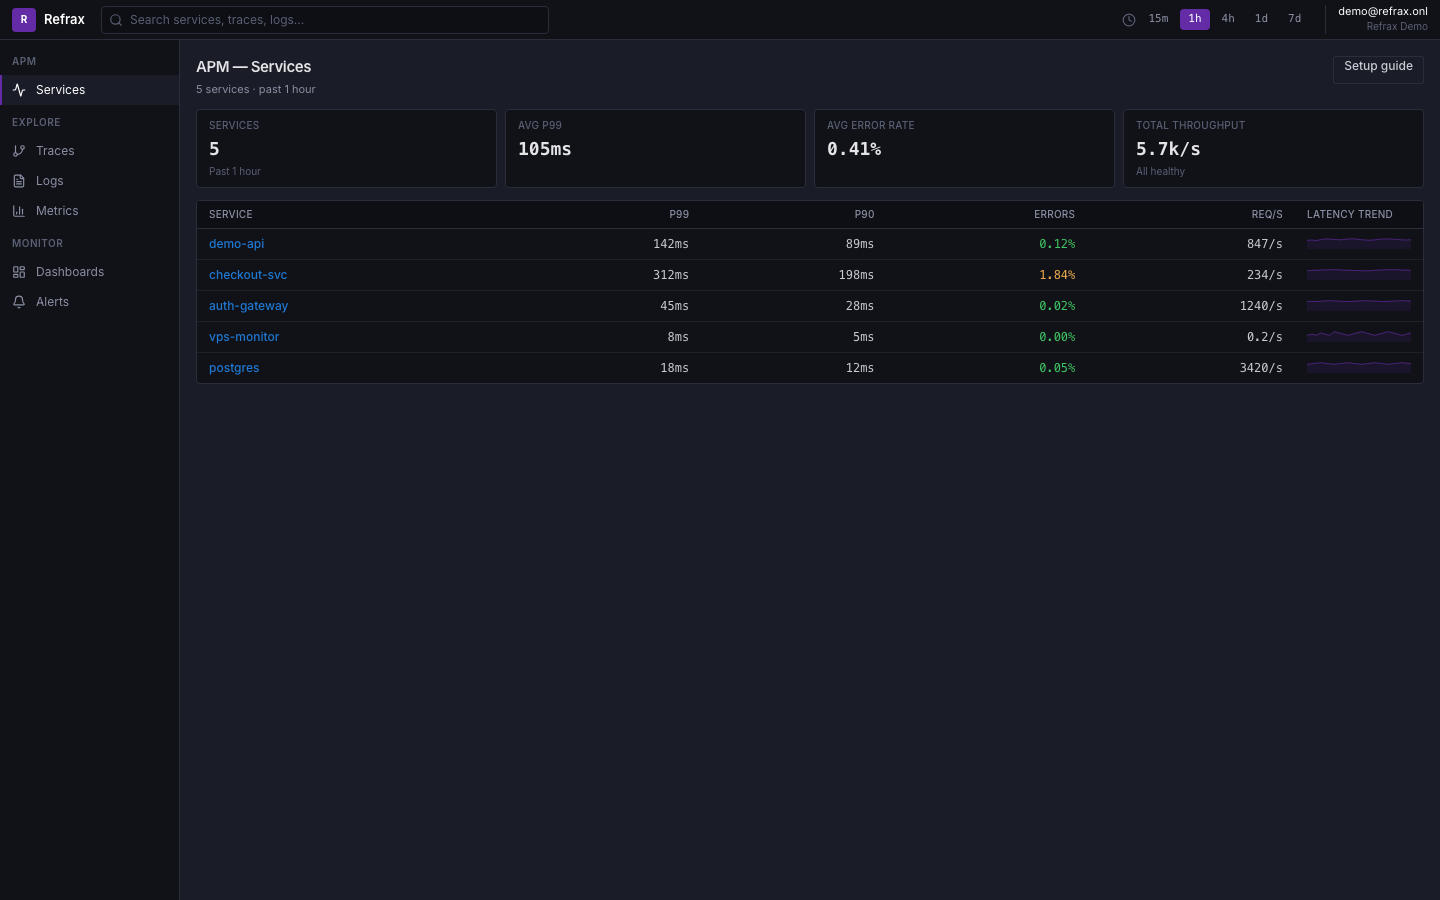
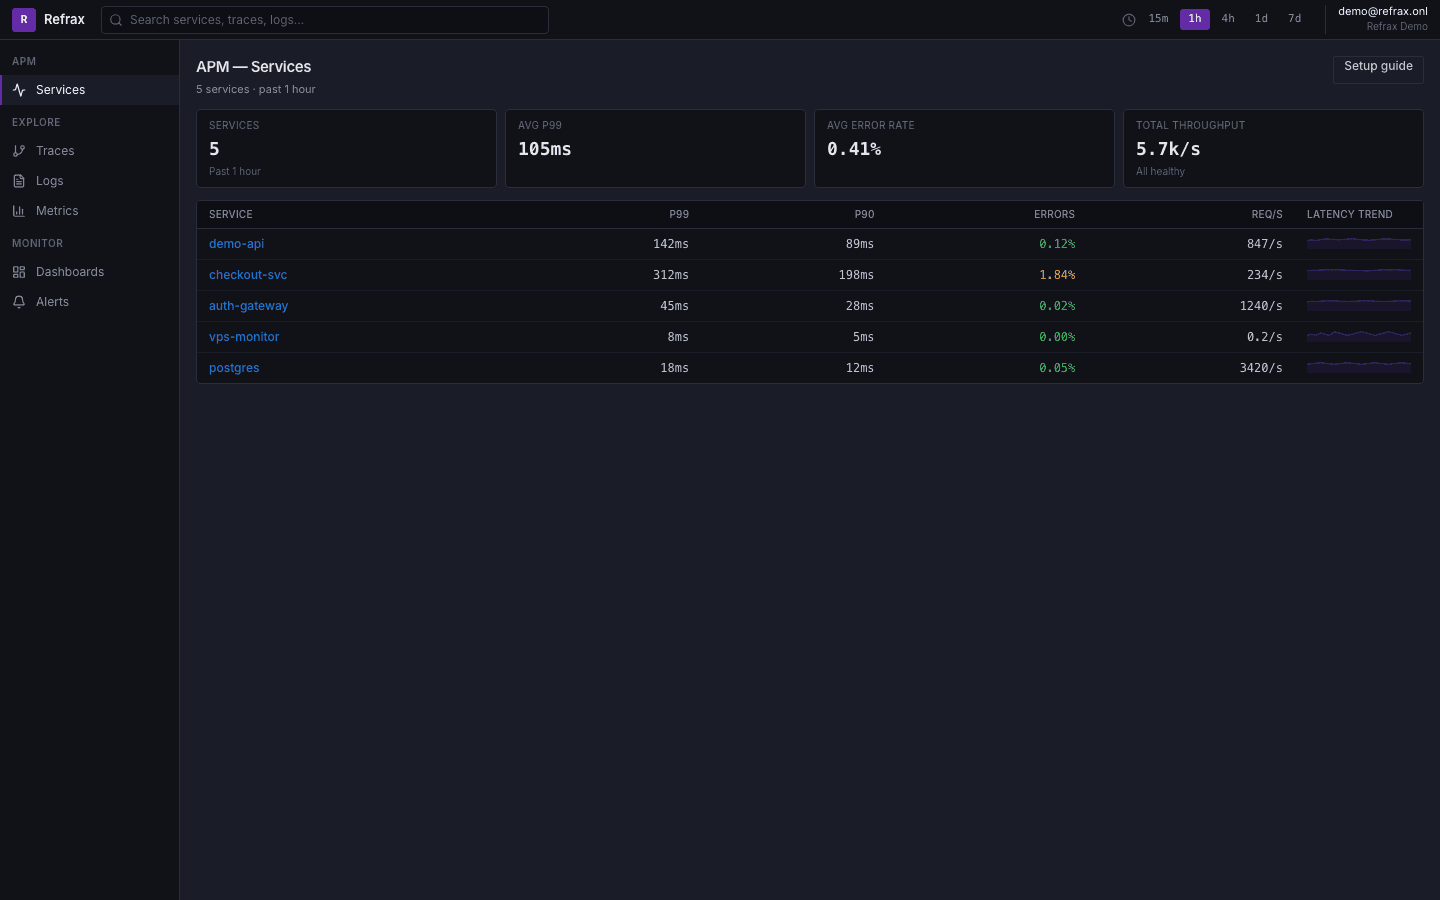
Application Performance Monitoring
Monitor service latency, error rates, and throughput with out-of-the-box APM charts powered by OpenTelemetry.
Learn more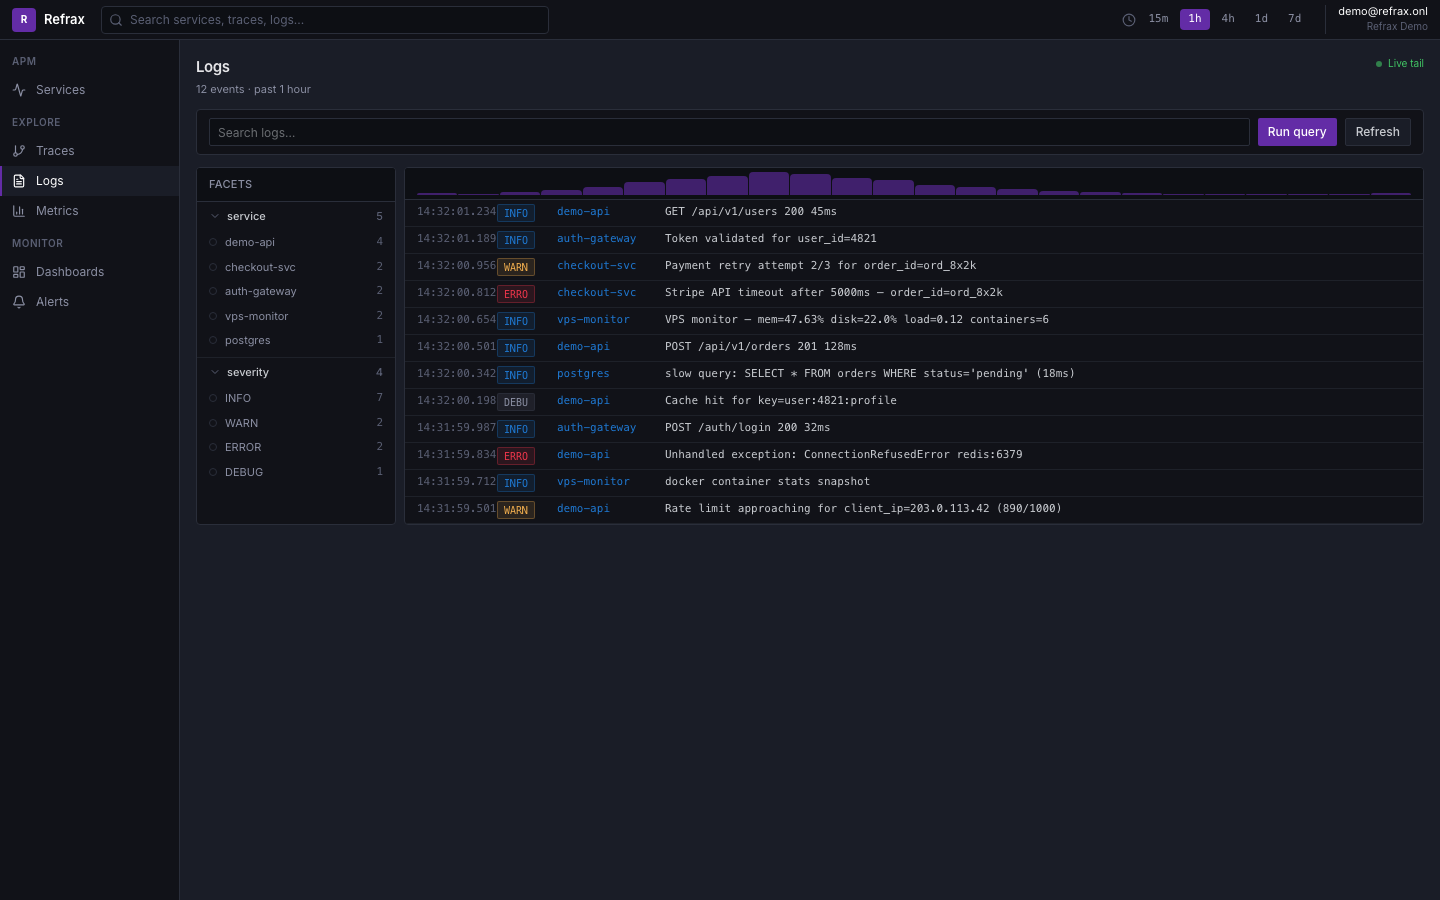
Log Management
Ingest, search, and analyze logs at any scale. Correlate logs with traces for faster debugging.
Learn more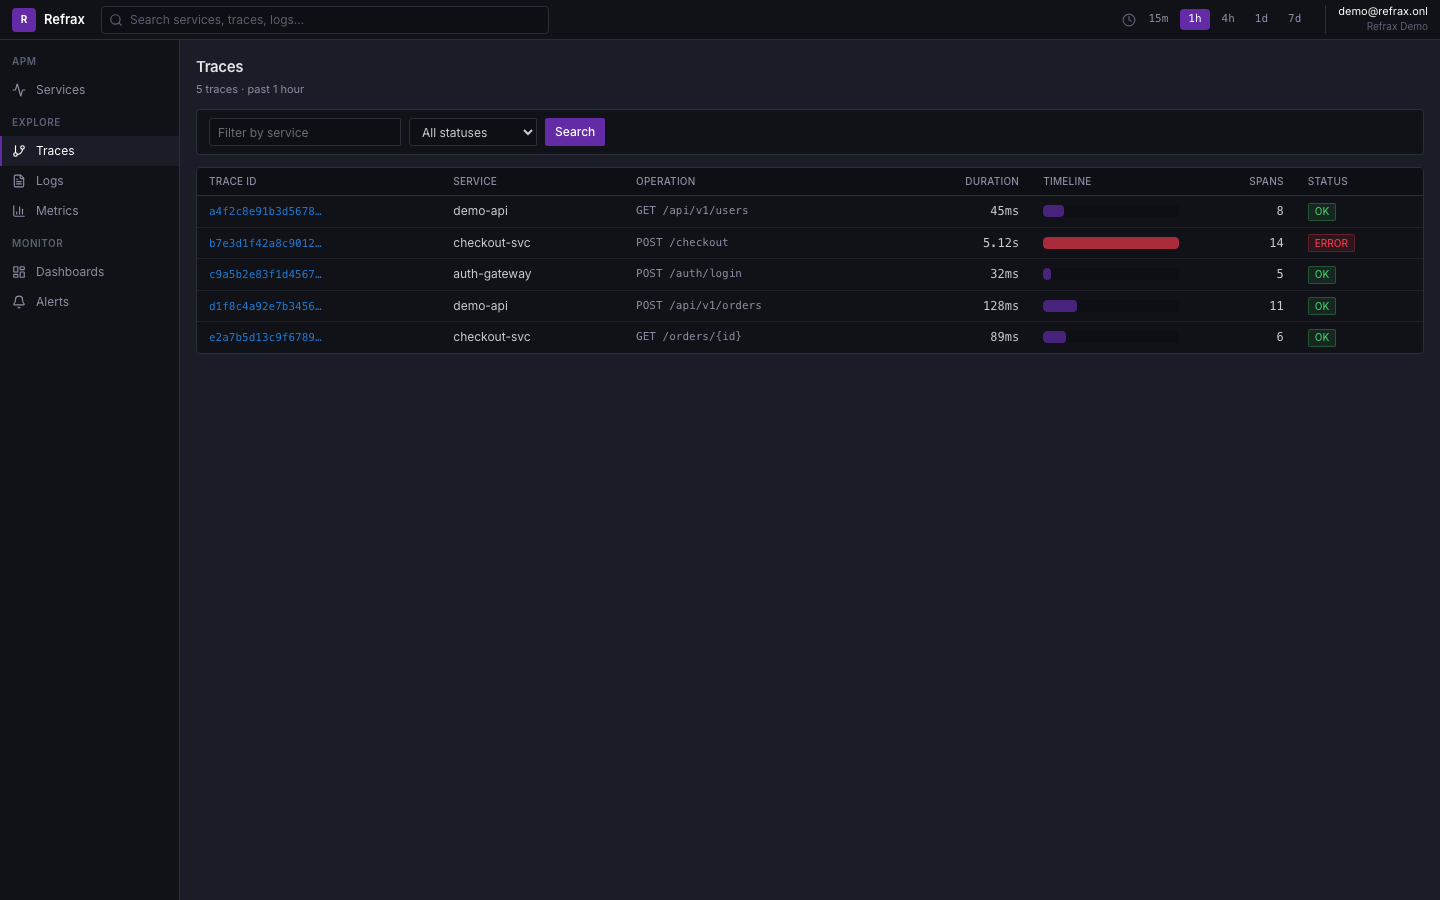
Distributed Tracing
Follow requests across microservices with flamegraphs and waterfall views to pinpoint bottlenecks.
Learn more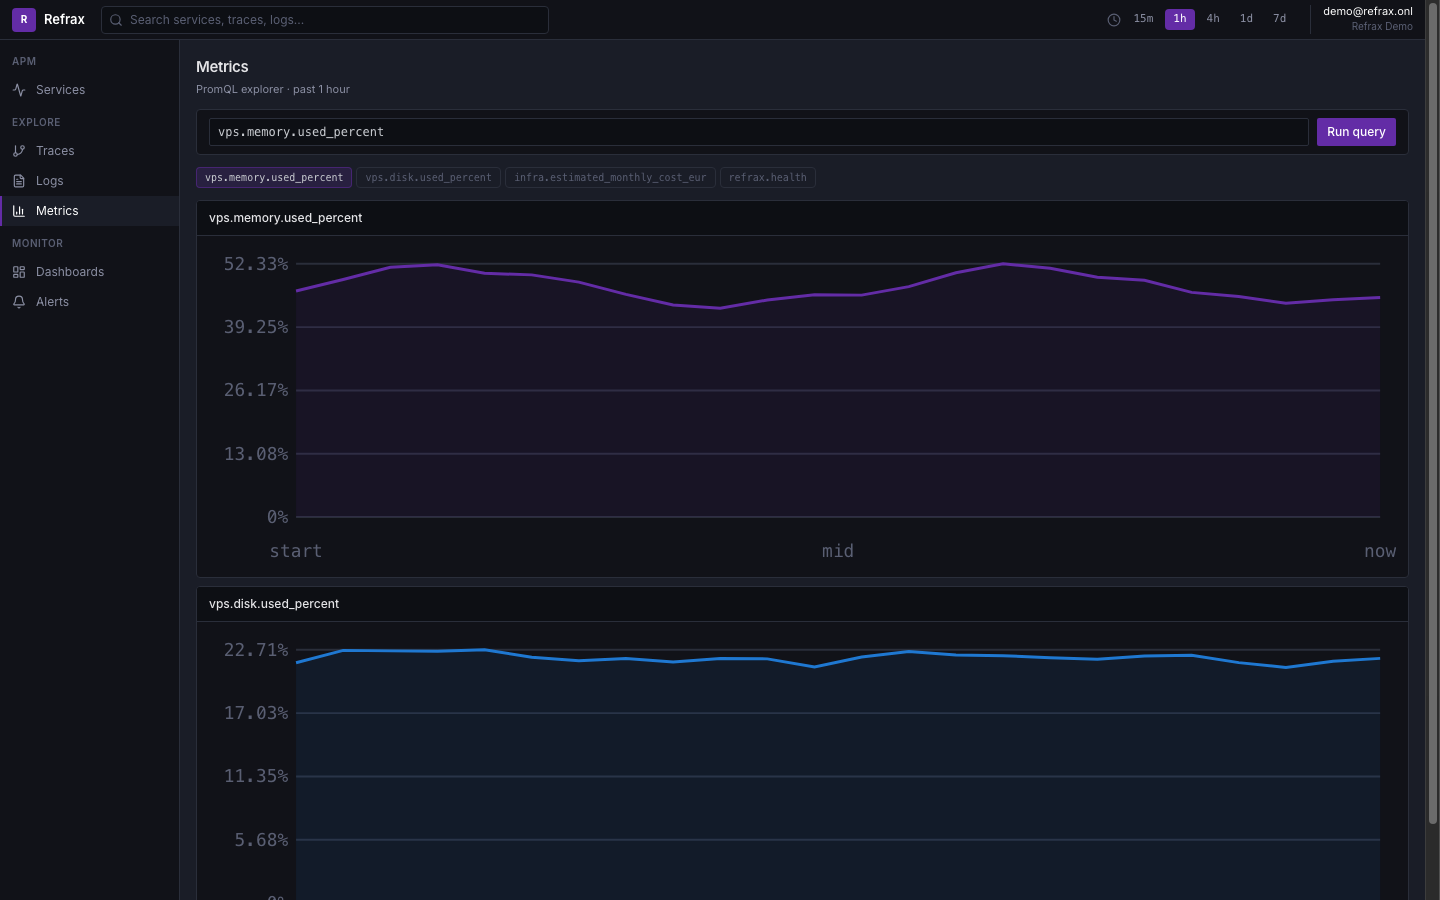
Metrics & Dashboards
Custom dashboards with PromQL support. Monitor infrastructure and application metrics in one place.
Learn more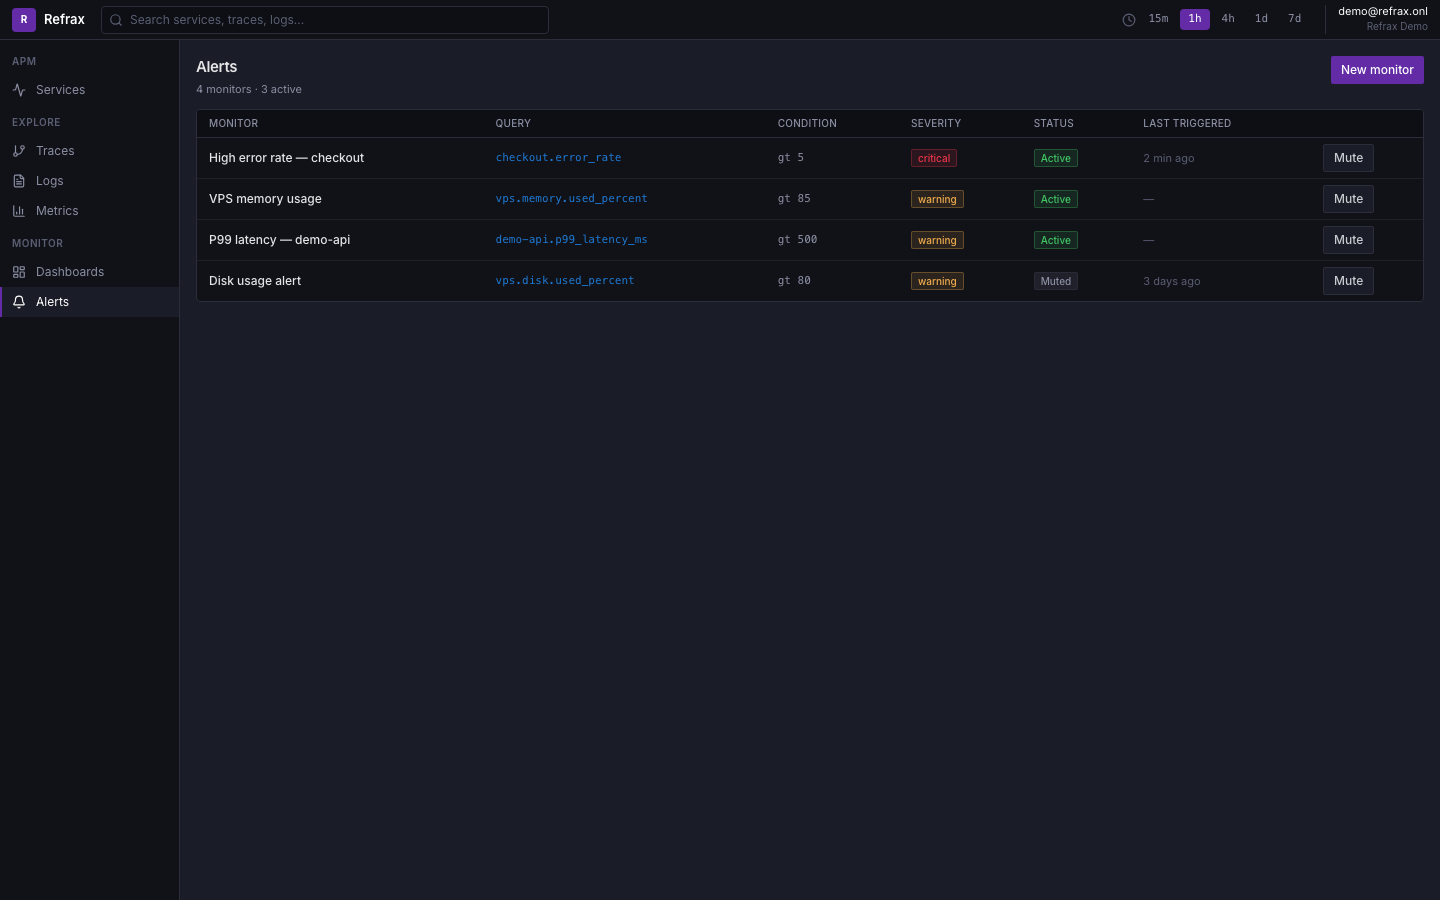
Alerts & Notifications
Set threshold alerts on any signal. Get notified via Slack or email when things go wrong.
Learn moreEnterprise SSO & SAML
SAML 2.0 and OIDC support with domain verification, JIT provisioning, and role mapping.
Learn more